

6 Nations Week 4 - Attack and Defence Analysis
We are halfway through the 6N and it's turning out to be a very interesting one, the amount of statistics available from different sources is really good and supplies us armchair international coaches with some sense of what is going on.
Defence Analysis:
| Tries For | Rank | Tries Against | Rank | Tackle Completion Average | Rank | |
|---|---|---|---|---|---|---|
| Wales | 9 | 2 | 7 | 4 | 88.1% | 2 |
| England | 6 | 3 | 6 | 3 | 87.6% | 3 |
| Italy | 3 | 5 | 14 | 6 | 86.3% | 4 |
| Scotland | 3 | 5 | 2 | 2 | 91% | 1 |
| France | 12 | 1 | 7 | 4 | 88.3% | 5 |
| Ireland | 6 | 3 | 5 | 2 | 87.1% | 6 |
In this table we look at tries scored and conceded by each team, so simply put France are scoring on average 4 Tries per game, and conceding just over 2. Scotland and Italy are only able to score 1 try in each game (on average). Hold on though, Scotland have only conceded 2 tries overall, this places them as rank number 1 in tries against. So are they the hardest team to score against? Do they have the best defence?

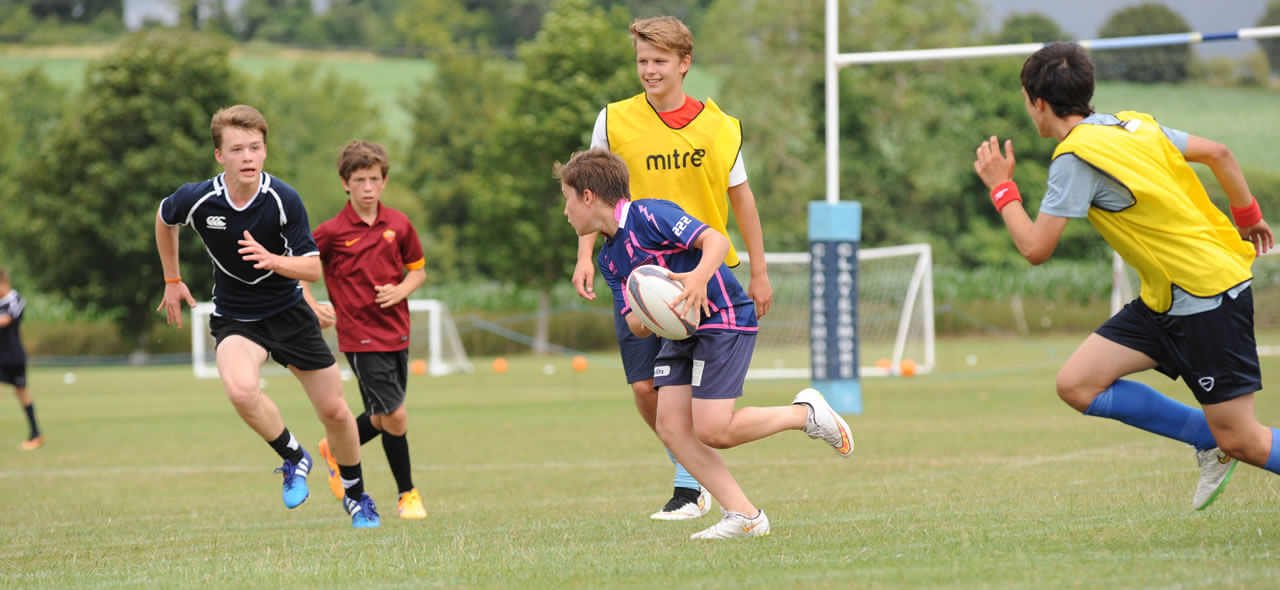
In this practice the importance of being connected and working as sub units within a team defensive policy is key to success; as is spacing, line speed and communication.
The 2nd half of the table above shows the tackle completion/success rate for each of the 3 games, and again Scotland dominate this with another number 1 Ranking - at an average 91% for each game they play. Making them a team that misses few tackles! Being a team that is consistent in tackle completion and more importantly tackle dominance is pretty impressive stuff from Scotland, spectators often see a team that is losing, not playing well or not achieving the targets they set. They are struggling to win but this isn’t due to their defence. They are extremely difficult to score against and if they can get their attack sorted they will be a successful side again.

However, the way we attack and how successful we are in using the ball differentiates many successful teams. Yet again in this Championship it isn’t how long or where you have the ball in terms of percentage but rather what you do with it. Winning teams often have the ball for less time than the losing team.

So how can we assess success in attack? In this article we will call attack – go forward which consists of:
- Meters run with the ball
- Number of kicks from hand
- The number of passes made
- The number of runs made (with the ball)
Add the actions all together and you get a total and average per game. If you simply look at the raw data then we get some odd results.
Attack Analysis:
| Game 1 | Game 2 | Game 3 | Total | Rank | |
|---|---|---|---|---|---|
| Wales | 914 | 521 | 880 | 2315 | 2 |
| England | 450 | 403 | 557 | 1410 | 6 |
| Italy | 775 | 803 | 2334 | 778 | 1 |
| Scotland | 913 | 494 | 650 | 2058 | 3 |
| France | 711 | 752 | 528 | 1991 | 4 |
| Ireland | 470 | 635 | 712 | 1817 | 5 |
So in essence, Italy for all their endeavour and effort in attack are not very good at converting this into points, plus they have the leakiest defence. Although it seems that England don’t do a lot with the ball from the table, they convert when it matters. These are generalisations yes, but they do say a lot about a team’s strategy and maybe the coaches philosophy.
If we are looking at trying to infer something from his data we can probably say that: "It is what you do with the ball rather than how much of it you have”.
Within a grassroots environment it is relatively easy to assess your own success in attack or Go Forward and your defensive performances. How you use this data is up to you but at least you can learn more about how your team might perform.